 Home
Home
 Privacy
Our A1C Calculator allows you to convert between A1C levels to blood glucose values.
A1C provides an average measure of blood sugar over the past 2–3 months.
The typical ranges are:
- Below 5.7% indicates normal blood sugar,
- 5.7%–6.4% suggests prediabetes,
- And 6.5% or higher indicates diabetes.
Use our tool to easily switch between HbA1c percentages and estimated average glucose (eAG) values.
Your A1C test result (also known as HbA1c or glycated hemoglobin) can be a good gauge of your diabetes control because it provides an estimated average blood glucose level over the past few months.
Unlike daily blood glucose test results, which are reported as mg/dL, A1C is often reported as a percentage, which can make it difficult to understand the relationship between the two values.
| A1C (%) | EAG (mg/dL) | EAG (mmol/L) | GMI (%) | Status | Comments |
|---|---|---|---|---|---|
| 4.0 | 68 | 3.8 | 5.4 | Below normal | May indicate hypoglycemia risk |
| 5.0 | 97 | 5.4 | 6.4 | Normal | Excellent control |
| 5.5 | 111 | 6.2 | 6.8 | Normal | Good control |
| 6.0 | 126 | 7.0 | 7.2 | Normal high | Monitor closely |
| 6.5 | 140 | 7.8 | 7.6 | Diabetes threshold | Treatment may be needed |
| 7.0 | 154 | 8.6 | 8.0 | Diabetes | Common treatment target |
| 7.5 | 169 | 9.4 | 8.4 | Above target | Treatment adjustment may be needed |
| 8.0 | 183 | 10.2 | 8.8 | High | Increased complication risk |
| 8.5 | 197 | 11.0 | 9.2 | Very high | Urgent action needed |
| 9.0 | 212 | 11.8 | 9.6 | Very high | High complication risk |
| 9.5 | 226 | 12.6 | 10.0 | Extremely high | Immediate action required |
| 10.0 | 240 | 13.4 | 10.4 | Extremely high | Critical level |
The A1C test, also known as HbA1c or glycated hemoglobin, measures the average blood glucose (sugar) levels over the past 2–3 months. It reflects the percentage of hemoglobin in your red blood cells that is coated with glucose. Here's how A1C is calculated and interpreted:
Hemoglobin is a protein in red blood cells that carries oxygen. When glucose is present in the bloodstream, it can attach to hemoglobin, forming glycated hemoglobin.
The A1C test measures the percentage of hemoglobin that is glycated, which provides an estimate of average blood glucose levels over the lifespan of red blood cells (approximately 120 days).
The A1C value is not directly "calculated" by a simple formula in real-time by patients or doctors, but rather determined through a laboratory test. Here's the process:
Blood Sample: A blood sample is taken, typically from a vein or finger prick.
Laboratory Analysis: The lab uses specialized equipment to measure the percentage of glycated hemoglobin in the sample. Common methods include:
Result: The result is reported as a percentage (e.g., 5.7%), representing the proportion of hemoglobin that is glycated.
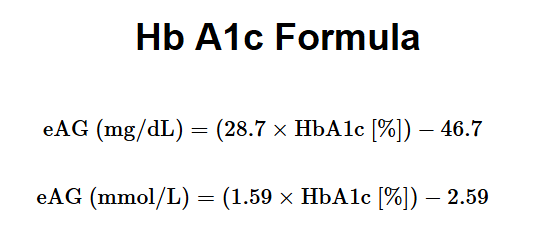
The A1C percentage correlates with average blood glucose levels over time. To estimate the average glucose (e.g., in mg/dL or mmol/L), the following formula is often used:
Estimated Average Glucose (eAG) Formula:
eAG (mg/dL) = 28.7 × A1C (%) – 46.7
eAG (mmol/L) = 1.59 × A1C (%) – 2.59
This formula converts the A1C percentage into an estimated average blood glucose level, making it easier to understand in terms of daily glucose readings.
Blood Glucose Levels: Higher blood glucose over time leads to higher A1C levels.
Red Blood Cell Lifespan: Conditions like anemia, hemolysis, or blood transfusions can affect red blood cell lifespan, altering A1C results.
Ethnicity and Genetics: Some populations may naturally have slightly higher or lower A1C levels.
Medical Conditions: Kidney disease, liver disease, or certain hemoglobin variants (e.g., HbS, HbC) can skew results.
Normal: 4.0%–5.6% (indicates good blood sugar control, no diabetes).
Prediabetes: 5.7%–6.4% (elevated blood sugar, lifestyle changes recommended).
Diabetes: 6.5% or higher (requires active blood sugar management).
These ranges are general guidelines, and individual targets may vary based on factors like age, health conditions, and diabetes management goals.
A1C doesn’t reflect day-to-day glucose fluctuations or recent changes in blood sugar.
It may not be accurate for people with certain blood disorders, pregnancy, or rapid red blood cell turnover.
A1C provides a long-term view of blood glucose control, helping doctors diagnose diabetes, monitor treatment effectiveness, and assess the risk of diabetes complications.
If you have a specific A1C result and want to understand its implications or convert it to an estimated average glucose (eAG), I can help with that calculation based on the formulas above. Let me know if you'd like further clarification or assistance!
The Hemoglobin A1c (HbA1c) Calculator converts the percentage of glycated hemoglobin (HbA1c) to the estimated average glucose (eAG) level over the past three months, using the following formulas:
For eAG in mg/dL:
For eAG in mmol/L:
Where:
Enter your HbA1c percentage and select the desired eAG unit to compute the result.
Understanding different A1C ranges and their implications for diabetes management.
Normal A1C levels indicate good blood sugar control.
| 4.0% | 4.1% | 4.2% | 4.3% | 4.4% | 4.5% |
| 4.6% | 4.7% | 4.8% | 4.9% | 5.0% | 5.1% |
| 5.2% | 5.3% | 5.4% | 5.5% | 5.6% |
Prediabetic range – lifestyle changes are recommended.
| 5.7% | 5.8% | 5.9% | 6.0% | 6.1% | 6.2% |
| 6.3% | 6.4% |
Diabetic range – active blood sugar management is needed.
| 6.5% | 6.6% | 6.7% | 6.8% | 6.9% | 7.0% |
| 7.1% | 7.2% | 7.3% | 7.4% | 7.5% | 7.6% |
| 7.7% | 7.8% | 7.9% | 8.0% | 8.1% | 8.2% |
| 8.3% | 8.4% | 8.5% | 8.6% | 8.7% | 8.8% |
| 8.9% | 9.0% | 9.1% | 9.2% | 9.3% | 9.4% |
| 9.5% | 9.6% | 9.7% | 9.8% | 9.9% |